When a Model Predicts Cancer Recurrence, Where Is It Looking?
Predicting biochemical recurrence after prostate surgery is one thing. Getting a clinician to trust that prediction is another.
A model that outputs a single probability score offers no way to verify whether it’s detecting the tumor, responding to noise, or picking up an imaging artifact. For clinical adoption, the question isn’t only what the model predicts; it’s where in the prostate and which imaging modality is driving it.
Can we trace the recurrence prediction back to specific voxels, validate that those voxels are meaningful, and show it to a clinician in a way they can actually use?
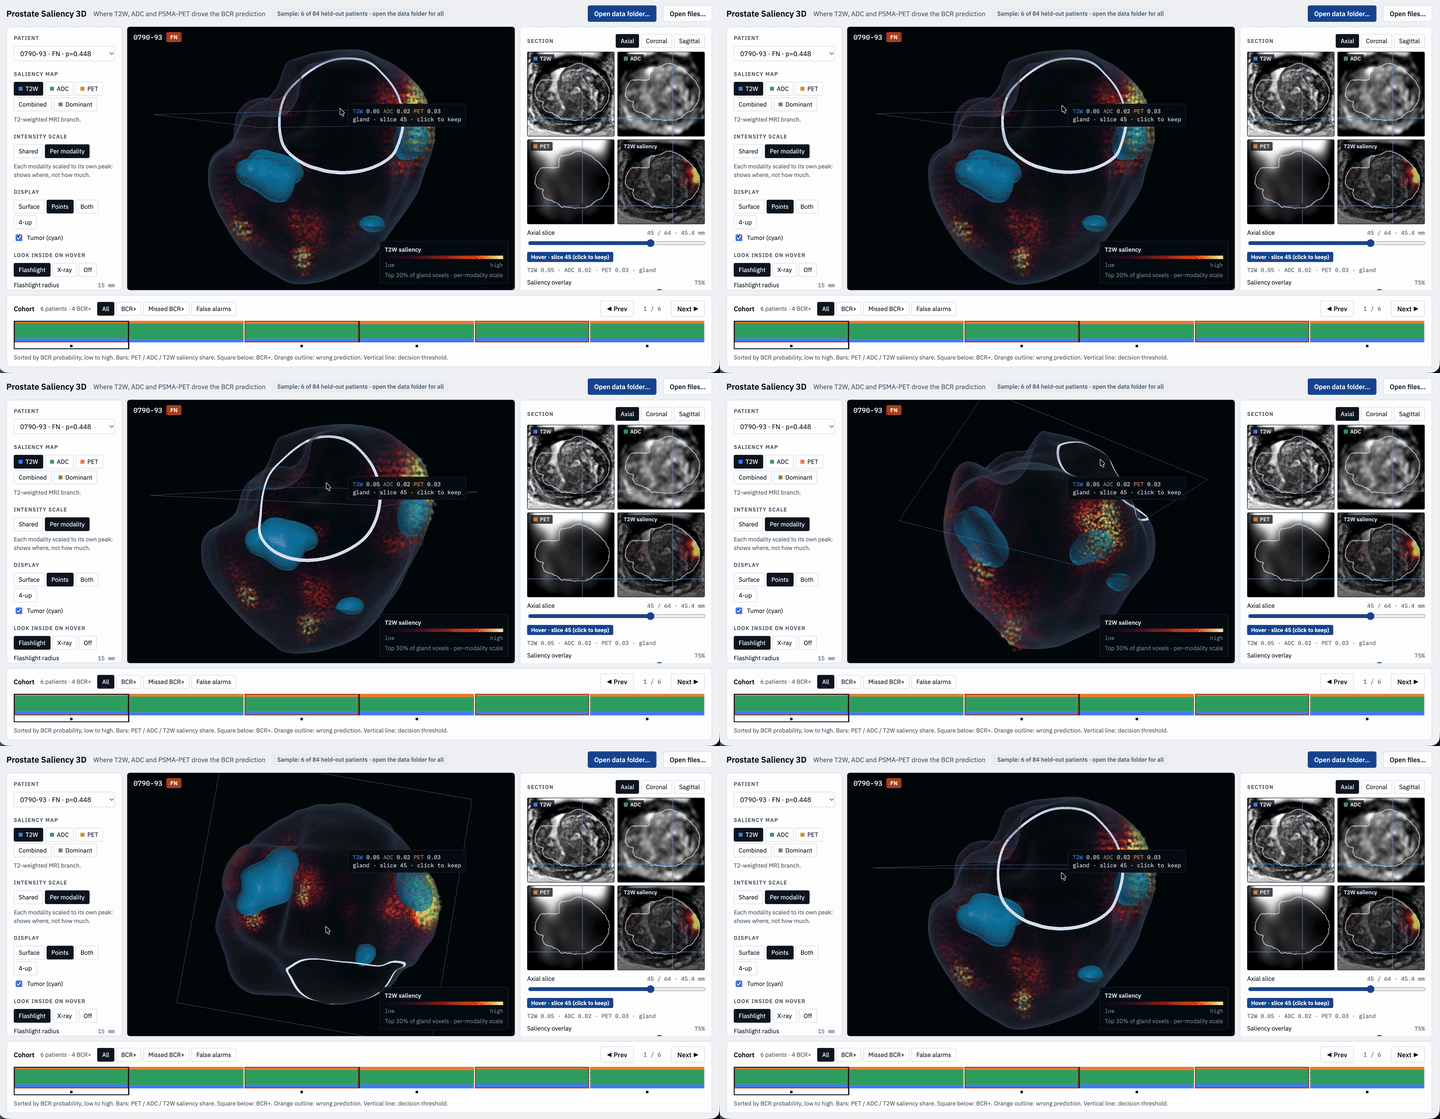
Alongside the BCR prediction model, we built an interactive 3D visualization tool that maps integrated gradient attributions – per-voxel, per-modality – back onto the prostate volume.
The viewer renders the gland as a 3D volume and overlays attribution scores as a color gradient, separately for T2W MRI, ADC, and PSMA-PET. The tumor region is overlaid in cyan. A clinician can rotate the volume, switch between modalities, toggle combined or dominant attribution view, and hover to reveal the interior with a flashlight or X-ray mode – all linked in real time to 2D axial, coronal, and sagittal cross-sections on the right panel. At the bottom, a cohort browser surfaces all patients in the held-out set, filterable by BCR+, missed BCR, or false alarms, with a stacked bar showing each patient’s per-modality saliency share.
Explore More Works and Projects!

